Sandia National Laboratories Study Overview
Overview
The dataset from Sandia National Labs used in the publication, “Degradation of Commercial Lithium-ion Cells as a Function of Chemistry and Cycling Conditions,” consists of commercial 18650 NCA, NMC, and LFP cells cycled to 80% capacity (although cycling is still ongoing). This study examines the influence of temperature, depth of discharge (DOD), and discharge current on the long-term degradation of the commercial cells.
Study Conditions
Cycle aging was carried out using an Arbin SCTS and an Arbin high-precision (Model: LBT21084) multi-channel battery testing system. Individual cells were placed into commercially available 18650 battery holders (Memory Protection Devices). The holders were connected to the Arbin with 18 gauge wire and the cable lengths kept below eight feet to minimize voltage drop. During cycling, the cells were placed in SPX Tenney Model T10C-1.5 environmental chambers. A K-type thermocouple was attached to the skin of each cell under test with Kapton tape to monitor the cell skin temperature.
Cycle Aging Protocol
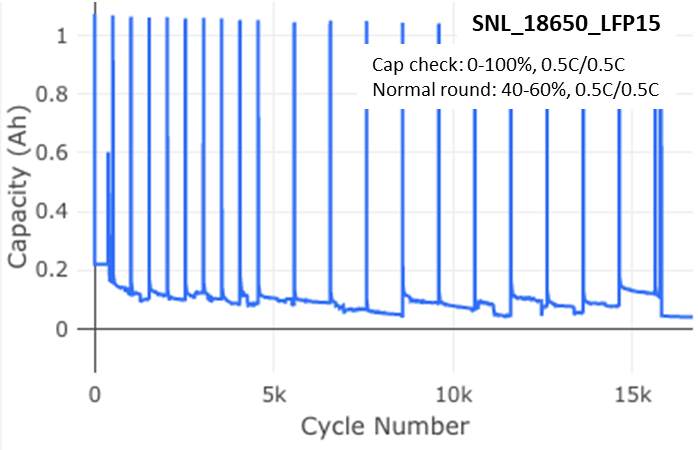
At the start of the study, the as-received cells were placed in thermal chambers for a day to equilibrate to the desired cycling temperatures. Then, the cells were discharged. Each round of cycling consisted of a capacity check, some number of cycles at the designated conditions for that cell, and another capacity check at the end. The capacity check consisted of three charge/discharge cycles from 0-100% SOC at 0.5C (a rate of 1C corresponds to the current that will discharge the full capacity of a battery in one hour). 100% SOC is defined as the capacity obtained at a 0.5C constant current charge with a current taper to 0.05A to the maximum manufacturer-specified charging voltage. The same capacity check protocol was employed for all cells in the study.
A round of cycling for each cell varied from 125 to 1000 cycles, depending on the rate of degradation at the specific test conditions. The cycle count for a round was halved if a cell experienced over 5% capacity loss in the previous round. These adjustments were intended to offer enough granulation in the capacity decline curve to enable observation of any changes in mechanism, while still maintaining a reasonable check-up frequency during a nearly three-year study.
The rated capacities of the cells were used as references for calculating C-rates. All cells were charged at a rate of 0.5C, per manufacturer guidance. Cells were cycled at 40-60% SOC using a constant current (CC) protocol based on capacity limits. Cells were cycled at 20-80% SOC with a CC protocol using voltage limits established from the discharge capacity curves of fresh cells. Cells cycling at 0-100% SOC were charged using a constant current constant voltage (CCCV) protocol, with a cut-off of 30 minutes or a current taper to 0.05A (whichever comes first). For the 100% DOD regime, LFP cells were cycled from 2 to 3.6V, NCA cells from 2.5 to 4.2V, and NMC cells from 2 to 4.2V. The cycling programs were not adjusted over the course of the study as the cells aged.
View DataData Artifacts
1 Periodic spikes in the data, as shown to the right, are due to the transition between the three cycle capacity check and the normal round of cycling.